2QFY2019 Result Update | Textiles
November 15, 2018
Siyaram Silk Mills
BUY
CMP
`374
Performance Update
Target Price
`549
Investment Period
12 months
Y/E March (` cr)
2QFY19
2QFY18
% chg (yoy)
1QFY19
% chg (qoq)
Stock Info
Net sales
Sector
Textiles
459
423
8.5
322
42.4
Market Cap (` cr)
1,752
EBITDA
62
64
(3.8)
34
82.1
Net Debt (` cr)
549
EBITDA margin (%)
13.5
15.2
(173bps)
10.5
293bp
Beta
0.6
Adjusted PAT
27
31
(11.0)
10
175.9
52 Week High / Low
799/321
Source: Company, Angel Research
Avg. Daily Volume
1,743
For 2QFY2019, Siyaram Silk Mills (SSML) posted subdued set of results, which
Face Value (`)
2
were below our expectations on both, top-line as well as bottom-line fronts.
BSE Sensex
35,260
Revenue grew ~9% yoy. On the margin front, the company reported operating
Nifty
10,617
Reuters Code
SIYR.BO
margin contraction by 173bps yoy. On the bottom-line front, SSML reported de-
Bloomberg Code
SIYA.IN
growth of ~11% yoy to ~`27cr due to subdued top-line growth.
Overall top-line growth moderate: The company’s top-line grew ~9% yoy to
Shareholding Pattern (%)
`459cr. During the quarter, marriage dates remained very low compared to last
Promoters
67.1
year, impacting the company’s overall sales, especially in tier 2 &3 cities, which
MF / Banks / Indian
8.1
FII / NRIs / OCBs
1.7
contribute 70% of SSML’s revenue.
Indian Public/Others
23.2
PAT declined by 11% yoy: On the operating front, the company’s margin
Abs.(%)
3m
1yr
3yr
contracted by 173bps yoy at 13.5%. PAT de-grew by 11% yoy due to poor
Sensex
(7.2)
6.7
36.4
operating performance, higher interest cost and higher taxes.
SSM
(27.8)
(33.6)
97.5
Outlook and Valuation: Going forward, we expect SSML to report net sales CAGR
of ~12% to ~`2,166cr and adj. net profit CAGR of ~13% to `147cr over
FY2018-20E on the back of market leadership in blended fabrics, strong brand
building, wide distribution channel and strong presence in tier 2 and tier 3 cities
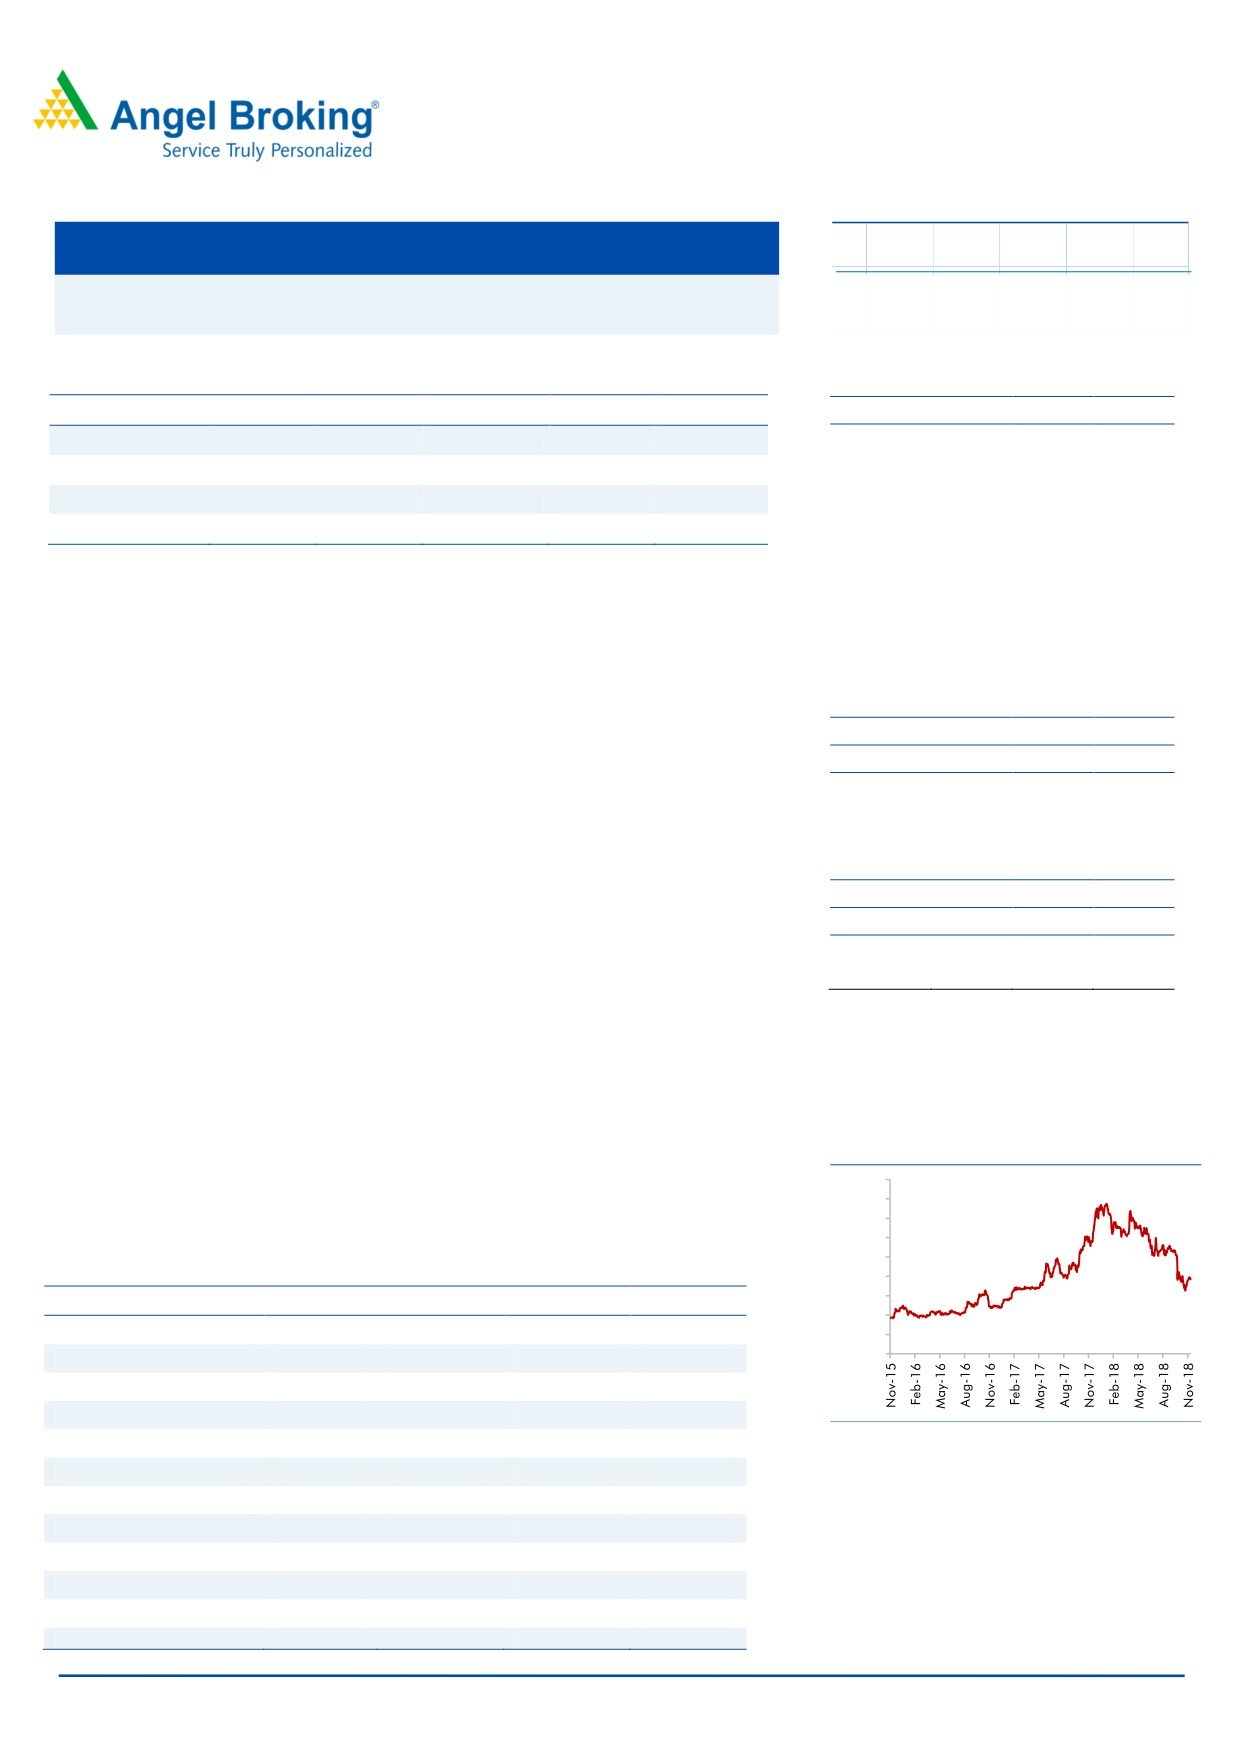
Historical share price chart
coupled with emphasis on latest designs and affordable pricing points. At the
900
current market prices, SSML trades at inexpensive valuations. We maintain our
800
700
Buy recommendation on the stock with a Target Price of `549.
600
500
Key Financials
400
300
Y/E March (` cr)
FY2017
FY2018
FY2019E
FY2020E
200
Net sales
1,574
1,733
1,902
2,166
100
0
% chg
(2.8)
10.1
9.7
13.9
Adj. Net profit
91
111
117
147
% chg
91.0
115.0
116.9
147.3
EBITDA margin (%)
12.5
14.2
13.8
14.3
Source: Company, Angel Research
EPS (`)
19.4
24.5
25.0
31.4
Amarjeet S Maurya
P/E (x)
19.3
15.2
15.0
11.9
022-40003600 Ext: 6831
P/BV (x)
2.9
2.6
2.2
1.9
RoE (%)
15.3
18.1
15.0
16.2
RoCE (%)
15.8
14.8
14.5
16.3
EV/Sales (x)
1.3
1.3
1.2
1.0
EV/EBITDA (x)
10.4
9.2
8.6
7.3
Source: Company, Angel Research Note: CMP as of November 15, 2018
Please refer to important disclosures at the end of this report
1
Siyaram Silk Mills| 2QFY2019 Result Update
Exhibit 1: 2QFY2019 Performance
Y/E March (` cr)
2QFY19
2QFY18
% chg. (yoy)
1QFY19
% chg. (qoq)
1HFY19
1HFY18
% chg
Net Sales
459
423
8.5
322
42.4
781
743
5.0
Net raw material
196.8
182
8.0
127.7
54.1
325
311
4.3
(% of Sales)
42.9
43.1
(22)
39.7
326
41.6
41.8
Employee Cost
51
47
10.4
47
10.5
98
91
7.8
(% of Sales)
11.2
11.0
19
14.4
(324)
12.5
12.2
Other Expenses
149
129
14.8
114
30.5
262
244
7.6
(% of Sales)
32.4
30.6
177
35.4
(296)
33.6
32.8
Total Expenditure
397
358
10.7
288
37.7
685
646
6.1
Operating Profit
62
64
(3.8)
34
82.1
96
97
(2)
OPM (%)
13.5
15.2
(173)
10.5
294
12.27
13.10
(83)
Interest
12
7
80.8
11
9.3
23
13
79.0
Depreciation
16
15
5.5
16
3.9
32
30
4.9
Other Income
6
6
9.8
8
(20.1)
14
10
41.5
PBT before exceptional
40
48
(16.9)
15
163.3
55
64
(14.2)
(% of Sales)
8.7
11.4
4.7
7.0
8.6
Exceptional Items
-
-
PBT
40
48
(16.9)
15
163.3
55.0
64.1
(14.2)
Tax
15
17
(10.7)
5
195.0
21
23
(10.4)
(% of PBT)
38.7
35.9
34.5
37.5
35.9
Reported PAT
24
31
(20.5)
10
146.6
34
41
(16.4)
PATM
5.3
7.3
3.1
4.4
5.5
Extra-ordinary Items
(3)
-
(3)
0
Adj PAT
27
31
(11.0)
10
175.9
37
41
(9.2)
Source: Company
November 15, 2018
2
Siyaram Silk Mills| 2QFY2019 Result Update
Outlook and Valuation
Going forward, we expect SSML to report net sales CAGR of ~12% to ~`2,166cr
and adj. net profit CAGR of ~13% to `147cr over FY2018-20E on the back of
market leadership in blended fabrics, strong brand building, wide distribution
channel and strong presence in tier 2 and tier 3 cities coupled with emphasis on
latest designs and affordable pricing points. At the current market prices, SSML
trades at inexpensive valuations. We maintain our Buy recommendation on the
stock with a Target Price of `549.
Downside risks to our estimates include
Decline in rural spending: Unseasonal rain or deficient rainfall in the rural areas
may result in lower agriculture output. This, in turn, could result in lower
discretionary spending among rural consumers, impacting the company’s overall
sales.
Competition from the unorganized sector: SSML, being in a sector that is highly
fragmented, faces intense competition from unorganized players as they usually
sell their products at a much cheaper rate compared to it. However, due to strong
branding efforts, huge distribution network and affordable price points, the
company is easily able to differentiate its products from those of competitors.
Fluctuation in raw material prices: SSML operates in a highly price sensitive
market. Any fluctuation in raw material prices can lead to margin compression, as
the company may not be able to pass on the entire increase to the end users.
Company Background
SSML is the largest manufacturer of blended fabrics in India. The company enjoys
a strong brand presence across the country, with brands such as Siyaram’s,
Mistair, MSD, J. Hampstead and Oxemberg in its kitty. The company has also
launched three premium brands - Royal Linen (linen fabrics for men and women),
Moretti (cotton shirting) and Zenesis (cotton suitings). SSML has built a strong
brand presence in the country through continuous advertisement and brand
building efforts over the past 30 years. The company has created a niche for itself
in a highly competitive industry. It has a wide distribution network comprising
1,600 dealers and 500 agents supplying to more than 40,000 outlets across India
and has ~160 franchise stores. The company operates four plants - one at
Tarapur near Mumbai for weaving and yarn dyeing, two at Daman for garments
and one at Silvassa for weaving.
November 15, 2018
3
Siyaram Silk Mills| 2QFY2019 Result Update
Profit & Loss Statement
Y/E March (` cr)
FY2017
FY2018
FY2019E
FY2020E
Total operating income
1,574
1,733
1,902
2,166
% chg
(2.8)
10.1
9.7
13.9
Total Expenditure
1,377
1,488
1,639
1,857
Cost of Materials
739
774
846
964
Personnel
169
190
209
243
Others Expenses
470
524
584
650
EBITDA
197
245
262
310
% chg
4.8
24.8
6.9
18.0
(% of Net Sales)
12.5
14.2
13.8
14.3
Depreciation& Amortisation
55
61
66
69
EBIT
142
185
196
241
% chg
(2.7)
30.0
6.1
23.0
(% of Net Sales)
9.0
10.7
10.3
11.1
Interest & other Charges
32
34
52
53
Other Income
26
26
30
32
(% of PBT)
18.8
14.9
17.2
14.6
Share in profit of Associates
-
-
-
-
Recurring PBT
136
177
175
220
% chg
2.4
30.2
(1.4)
26.0
Prior Period & Extraordinary Expense/(Inc.)
-
(6)
-
-
PBT (reported)
136
183
175
220
Tax
45
60
58
73
(% of PBT)
33.1
32.8
33.0
33.0
PAT (reported)
91
123
117
147
Add: Share of earnings of associate
-
-
-
-
ADJ. PAT
91
117
117
147
% chg
3.9
26.4
1.7
26.0
(% of Net Sales)
5.8
6.8
6.1
6.8
Basic EPS (`)
19.4
24.5
25.0
31.4
Fully Diluted EPS (`)
19.4
24.5
25.0
31.4
% chg
3.9
26.4
1.7
26.0
November 15, 2018
4
Siyaram Silk Mills| 2QFY2019 Result Update
Balance Sheet
Y/E March (` cr)
FY2017
FY2018
FY2019E
FY2020E
SOURCES OF FUNDS
Equity Share Capital
9
9
9
9
Reserves& Surplus
587
669
772
902
Shareholders Funds
597
679
782
911
Minority Interest
-
-
-
-
Total Loans
305
573
570
570
Deferred Tax Liability
20
15
15
15
Total Liabilities
921
1,267
1,395
1,560
APPLICATION OF FUNDS
Gross Block
481
582
602
622
Less: Acc. Depreciation
86
143
209
278
Net Block
395
439
392
344
Capital Work-in-Progress
36
93
93
93
Investments
14
33
33
33
Current Assets
714
989
1,163
1,403
Inventories
316
430
500
582
Sundry Debtors
305
422
485
564
Cash
5
23
26
41
Loans & Advances
55
81
95
130
Other Assets
34
33
57
87
Current liabilities
238
286
286
312
Net Current Assets
476
703
877
1,091
Deferred Tax Asset
-
-
-
-
Mis. Exp. not written off
-
-
-
-
Total Assets
921
1,267
1,395
1,560
November 15, 2018
5
Siyaram Silk Mills| 2QFY2019 Result Update
Consolidated Cashflow Statement
Y/E March (`cr)
FY2017
FY2018
FY2019E
FY2020E
Profit before tax
136
177
175
220
Depreciation
55
61
66
69
Change in Working Capital
47
(281)
(171)
(199)
Interest / Dividend (Net)
18
19
52
53
Direct taxes paid
-
-
(58)
(73)
Others
(52)
(4)
-
-
Cash Flow from Operations
203
(28)
64
71
(Inc.)/ Dec. in Fixed Assets
(68)
(176)
(20)
(20)
(Inc.)/ Dec. in Investments
1
(19)
-
-
Cash Flow from Investing
(69)
(158)
(20)
(20)
Issue of Equity
-
-
-
-
Inc./(Dec.) in loans
-
-
(3)
-
Dividend Paid (Incl. Tax)
(0)
1
14
18
Interest / Dividend (Net)
(134)
204
(52)
(53)
Cash Flow from Financing
(135)
205
(41)
(36)
Inc./(Dec.) in Cash
(1)
19
3
15
Opening Cash balances
5
4
23
26
Closing Cash balances
4
23
26
41
November 15, 2018
6
Siyaram Silk Mills| 2QFY2019 Result Update
Key ratios
Y/E March
FY2017
FY2018
FY2019E FY2020E
Valuation Ratio (x)
P/E (on FDEPS)
19.3
15.2
15.0
11.9
P/CEPS
19.4
24.5
24.9
31.4
P/BV
2.9
2.6
2.2
1.9
Dividend yield (%)
2.9
3.7
3.8
4.7
EV/Sales
1.3
1.3
1.2
1.0
EV/EBITDA
10.4
9.2
8.6
7.3
EV / Total Assets
1.8
1.5
1.3
1.2
Per Share Data (`)
EPS (Basic)
19.4
24.5
25.0
31.4
EPS (fully diluted)
19.4
24.5
25.0
31.4
Cash EPS
19.3
15.3
15.0
11.9
DPS
10.9
13.8
14.0
17.7
Book Value
127.3
144.8
166.8
194.5
Returns (%)
ROCE
15.8
14.8
14.5
16.3
Angel ROIC (Pre-tax)
16.1
15.5
15.2
17.1
ROE
15.3
18.1
15.0
16.2
Turnover ratios (x)
Asset Turnover (Gross Block)
3.3
3.0
3.2
3.5
Inventory / Sales (days)
73
91
96
98
Receivables (days)
71
89
93
95
Payables (days)
33
38
35
33
Working capital cycle (ex-cash) (days)
111
141
154
160
Source: Company, Angel Research
November 15, 2018
7
Siyaram Silk Mills| 2QFY2019 Result Update
Research Team Tel: 022 - 39357800
DISCLAIMER
Angel Broking Limited (hereinafter referred to as “Angel”) is a registered Member of National Stock Exchange of India Limited, Bombay
Stock Exchange Limited, Metropolitan Stock Exchange Limited, Multi Commodity Exchange of India Ltd and National Commodity &
Derivatives Exchange Ltd It is also registered as a Depository Participant with CDSL and Portfolio Manager and Investment Adviser with
SEBI. It also has registration with AMFI as a Mutual Fund Distributor. Angel Broking Limited is a registered entity with SEBI for Research
Analyst in terms of SEBI (Research Analyst) Regulations, 2014 vide registration number INH000000164. Angel or its associates has not
been debarred/ suspended by SEBI or any other regulatory authority for accessing /dealing in securities Market. Angel or its
associates/analyst has not received any compensation / managed or co-managed public offering of securities of the company covered
by Analyst during the past twelve months.
This document is solely for the personal information of the recipient, and must not be singularly used as the basis of any investment
decision. Nothing in this document should be construed as investment or financial advice. Each recipient of this document should make
such investigations as they deem necessary to arrive at an independent evaluation of an investment in the securities of the companies
referred to in this document (including the merits and risks involved), and should consult their own advisors to determine the merits and
risks of such an investment.
Reports based on technical and derivative analysis center on studying charts of a stock's price movement, outstanding positions and
trading volume, as opposed to focusing on a company's fundamentals and, as such, may not match with a report on a company's
fundamentals. Investors are advised to refer the Fundamental and Technical Research Reports available on our website to evaluate the
contrary view, if any
The information in this document has been printed on the basis of publicly available information, internal data and other reliable
sources believed to be true, but we do not represent that it is accurate or complete and it should not be relied on as such, as this
document is for general guidance only. Angel Broking Limited or any of its affiliates/ group companies shall not be in any way
responsible for any loss or damage that may arise to any person from any inadvertent error in the information contained in this report.
Angel Broking Limited has not independently verified all the information contained within this document. Accordingly, we cannot testify,
nor make any representation or warranty, express or implied, to the accuracy, contents or data contained within this document. While
Angel Broking Limited endeavors to update on a reasonable basis the information discussed in this material, there may be regulatory,
compliance, or other reasons that prevent us from doing so.
This document is being supplied to you solely for your information, and its contents, information or data may not be reproduced,
redistributed or passed on, directly or indirectly.
Neither Angel Broking Limited, nor its directors, employees or affiliates shall be liable for any loss or damage that may arise from or in
connection with the use of this information.
Disclosure of Interest Statement
Siyaram Silk Mills
1. Financial interest of research analyst or Angel or his Associate or his relative
No
2. Ownership of 1% or more of the stock by research analyst or Angel or associates or relatives
No
3. Served as an officer, director or employee of the company covered under Research
No
4. Broking relationship with company covered under Research
No
Note: We have not considered any Exposure below ` 1 lakh for Angel, its Group companies and Directors
Ratings (Returns):
Buy (> 15%)
Accumulate (5% to 15%)
Neutral (-5 to 5%)
Reduce (-5% to -15%)
Sell (< -15%)
November 15, 2018
8